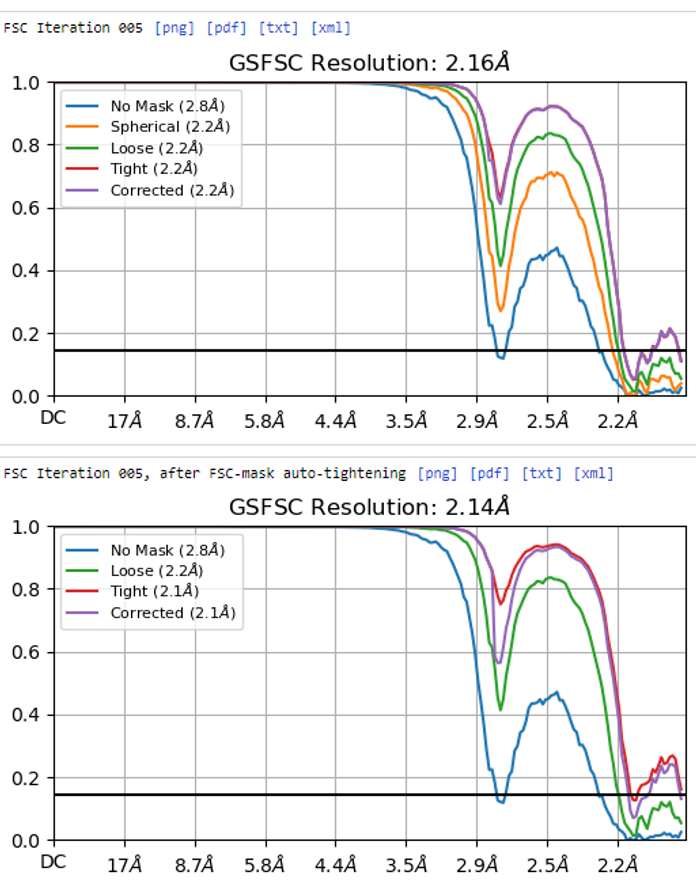
Hi I am processing an icosahedral virus that may have more than one conformation - which is not easy to see at low resolution. I wanted to see the most predominant conformation so I did a homogenous reconstruction and the FSC plot had a bump - is this because of the potential heterogeneity in the sample or is it something else? I am attaching an image of the FSC plot.
Any information you can provide would be greatly appreciated.
A few possibilities, but the two most likely are beam tilt is large (fix by global CTF refinement) or pixel size is wrong.
edit: When I say “fix” I mean “correct for” or “compensate for”. ![]() Just thought I’d clarify.
Just thought I’d clarify.
If beam tilt or pixel size related (beam tilt is easier to compensate for) you might find you hit the Nyquist limit of your current sampling. Are the particle downsampled? If so, move to unbinned particles and when all of the electro-optical parameters are corrected for, you will probably find you get <2A (if FSC falls correctly to zero). If >40nm, with Ewald sphere correction in the correct direction (you will have to try both positive and negative) it may extend to ~1.6-1.7A or so.
2 Likes
I have seen this kind of fsc curve with wrong pixel size causing wrong ctf estimation and it becomes more pronounced at such high res. Check the map against the model and optimize the pixel size to check it is correct. If it was off by even 2-3%, re-import the mics with proper pixel size and redo ctf estimation, then patch ctf extract with your particles and then re-refine those particles.
And the resolution tick marks are based on the pixel size…
Thank you, I will try global ctf refinement.
Dear cryofun,
this also sounds like a good idea. I will check the size of the map against the model and reprocess the data if the pixel size is off. Thanks again.
Best regard