I have a CTF fit resolution plot over all images that seems unusual, and I haven’t an idea how to address it. I don’t know if the data are bad in some particular way, or if the CTF estimation job contained non-ideal fitting values. If in curating the exposures I exclude images beyond 5A resolution, I lose 85% of my data. Has anyone got any insight on this phenomenon?

1 Like
I think you need to look at the images and think about what went wrong. My naive guess, without seeing any of the actual data, is that all of the higher resolution fit images contain carbon, the sample / ice quality is sufficient for 5-10 Å fits in most images, and >10 Å fits are due to crystalline ice, failed motion correction, or severe radiation damage.
It is also possible the microscope was somehow responsible. Our facility deployed remote collection in response to the pandemic and early on there were a few similar cases caused by forgetting the turbo or confusion with the apertures.
2 Likes
I’ve looked at the images and I couldn’t discern from the Thon rings or the images themselves that there was any obvious trend with resolution; crystalline ice appeared relatively infrequently by these observations. But I don’t know how to look for severe radiation damage other than to suspect it as a cause of low resolution. How would failed motion correction manifest? Or, in what part of the patch motion correction job output would this situation be evident?
I had something like this happen- half the micrographs at around 3.5 but then almost half at 25A. For me I think I specified the spherical aberration incorrectly during micrograph input. I think correcting that to 2.7mm fixed the issue, although it may have been that I input the electron dose incorrectly, since I screwed that up as well (put in 1 e/Aˆ2 instead of the 34 e/Aˆ2 that should have been there since I was inputting already-motion-corrected micrographs)
1 Like
@jenchem Dose is only used during motion correction, if you’re importing micrographs instead of movies it doesn’t matter what you enter. (And you have to enter something).
Hi Emily,
what do the CTF fit plots look like for the failed images? If using Patch CTF, with some datasets it tends to find a false optimum with the default defocus search range in the 1D search, and restricting the search range helps - could that be the case here?
Cheers
Oli
Hi All,
It looks like part of the problem was having used an incorrect gain reference file (we hadn’t used the super-res mode one for the K3). Now that I have used the right file, I can retain a lot more of the data (~55% versus ~15%), but there’s still a kind of clustering of CTF fit values, with values ‘missing’ near to 4A. (This image is representative of a different dataset than the one I showed in my original post, but the trends are the same.) 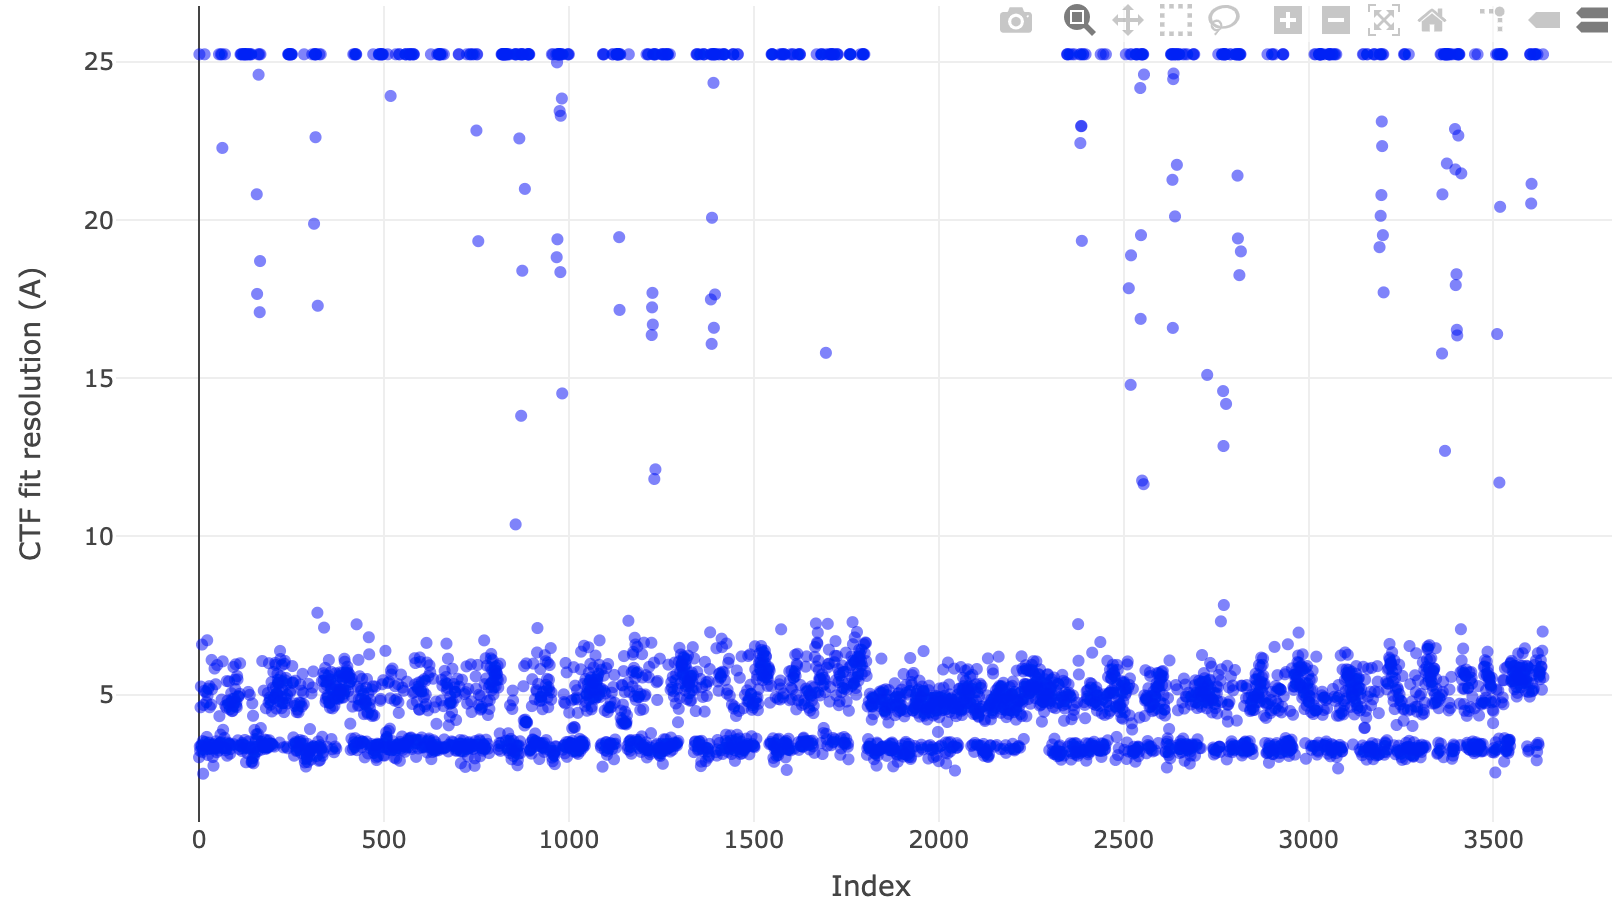
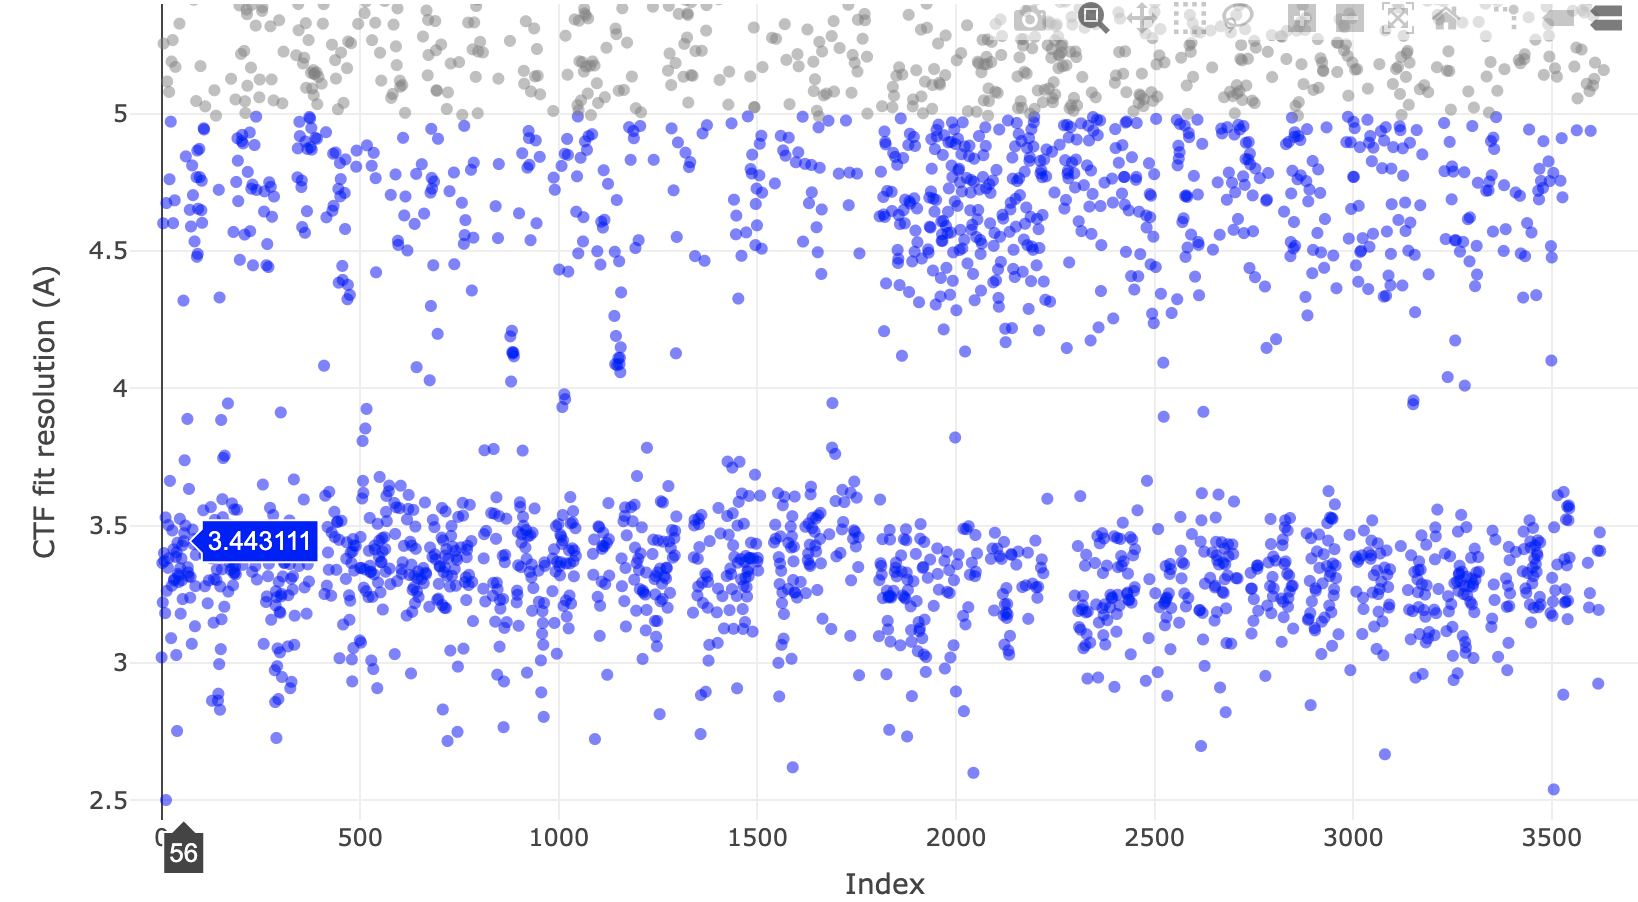
@olibclarke, firstly the CTF fits do look odd in many images just on either side of 4A, for example:
whereas better than ~ 3.8A or worse than ~ 4.15A the fits seem reasonable 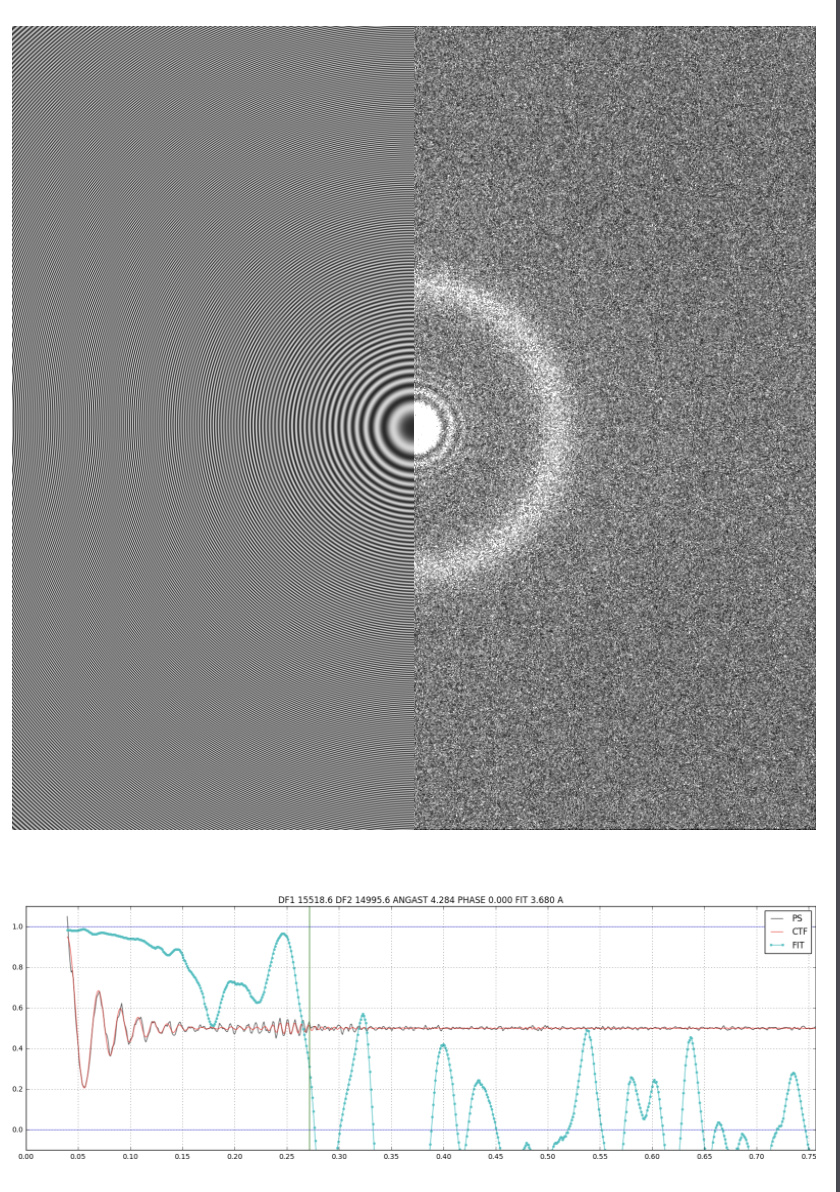
Secondly, I’m curious about your suggestion to restrict the defocus search during patch CTF estimation. The defaults are 1000 to 40000A. Will you please give me some rationale for how to restrict the range or why? As I understand, the defocus value relates to the number of Thon rings. The current CTF estimation job shows the following for the defocus distributions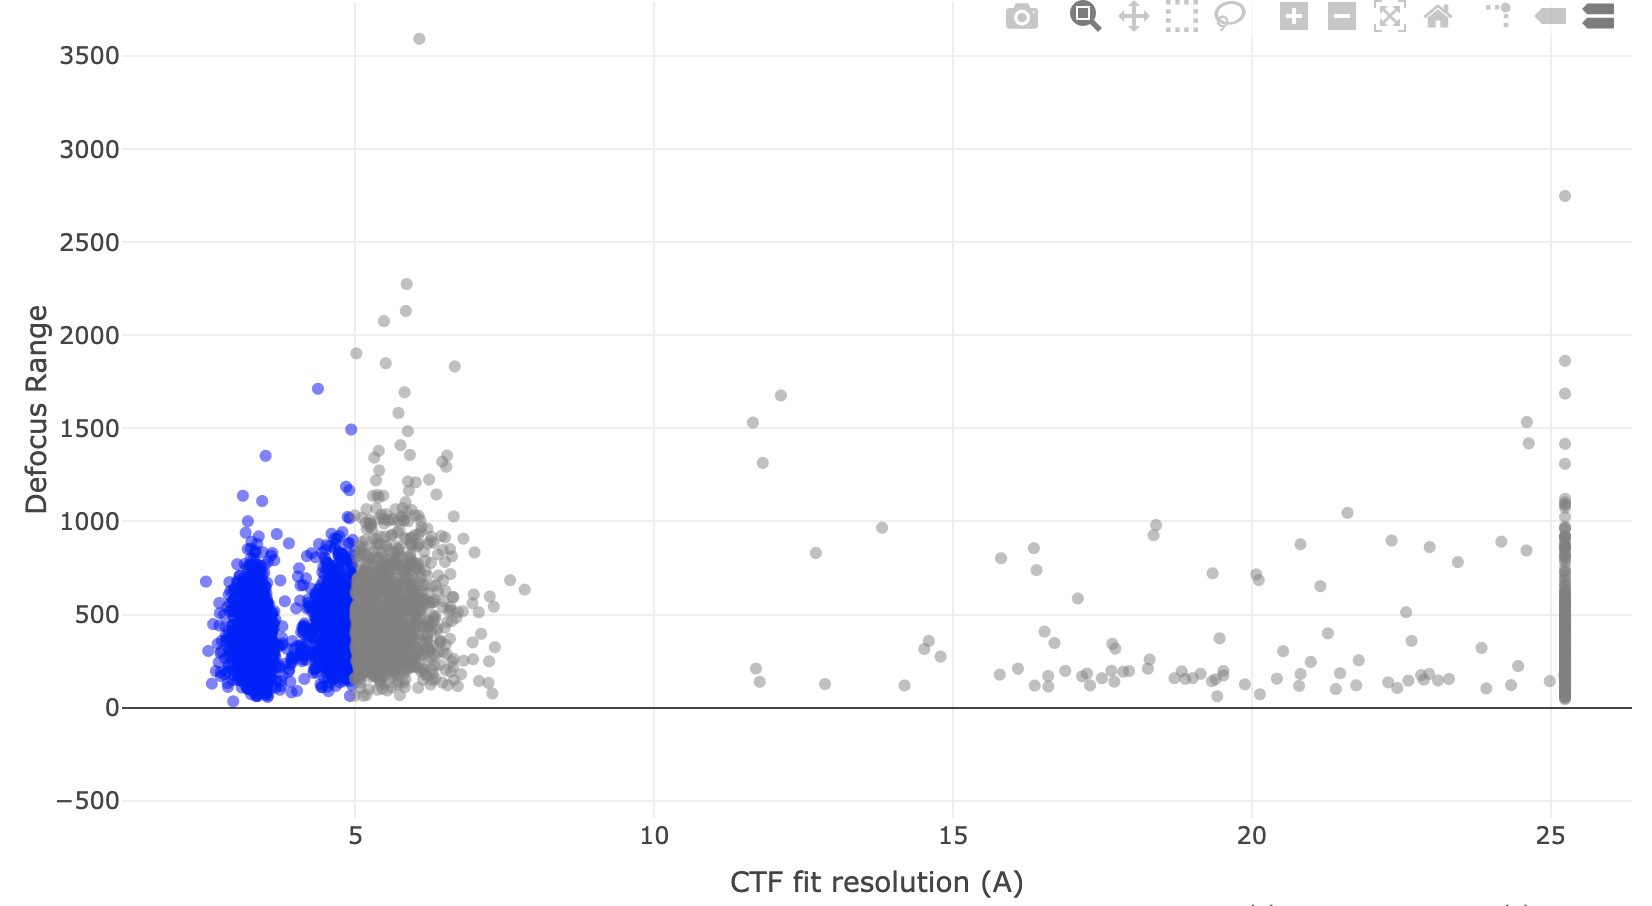 which doesn’t alarm me …though should it? I am still getting the feel for processing and appreciate any insight.
what defocus range are you collecting? that plot is typically in Å - this data would be super close to focus (0-0.2µm). Are you using a phase plate?
also if you have a very strong water ring (as these examples do), you might find you get better results lowering the maximum resolution used for fitting, say to 4.5 or 5 Å - maybe that is throwing it off in some cases
I agree with Oli, that water ring may be throwing off the fits.
The CTF plot you have shown is the Defocus Range, which I believe is the range across each micrograph as estimated by the patches. I think you want to look at the Defocus Average plot.
The defaults in patch CTF correspond to 0.1 - 4 micron defocus. I have found for some difficult data, I restrict to 10000 to 40000 (1 - 4 micron). Depending on your data collection parameters you can vary the defaults to be closer to your data, keeping in mind autofocus isn’t perfect.
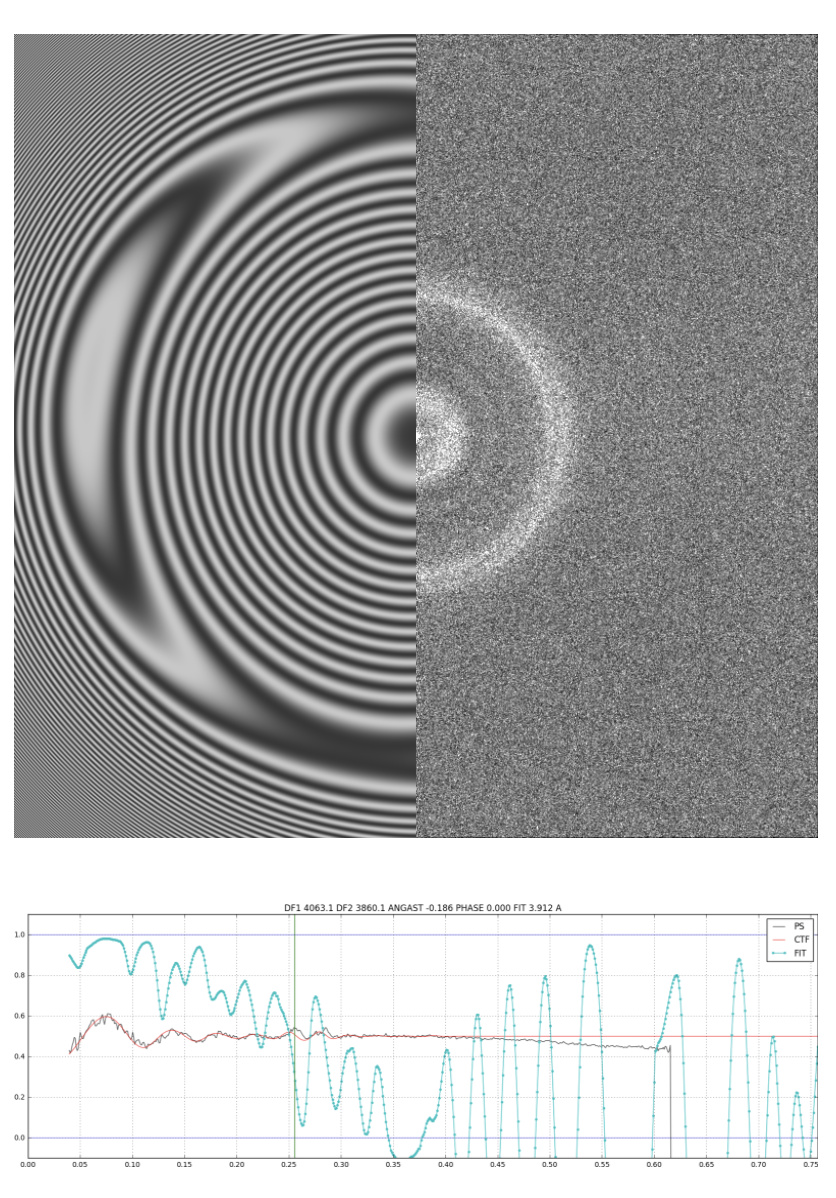
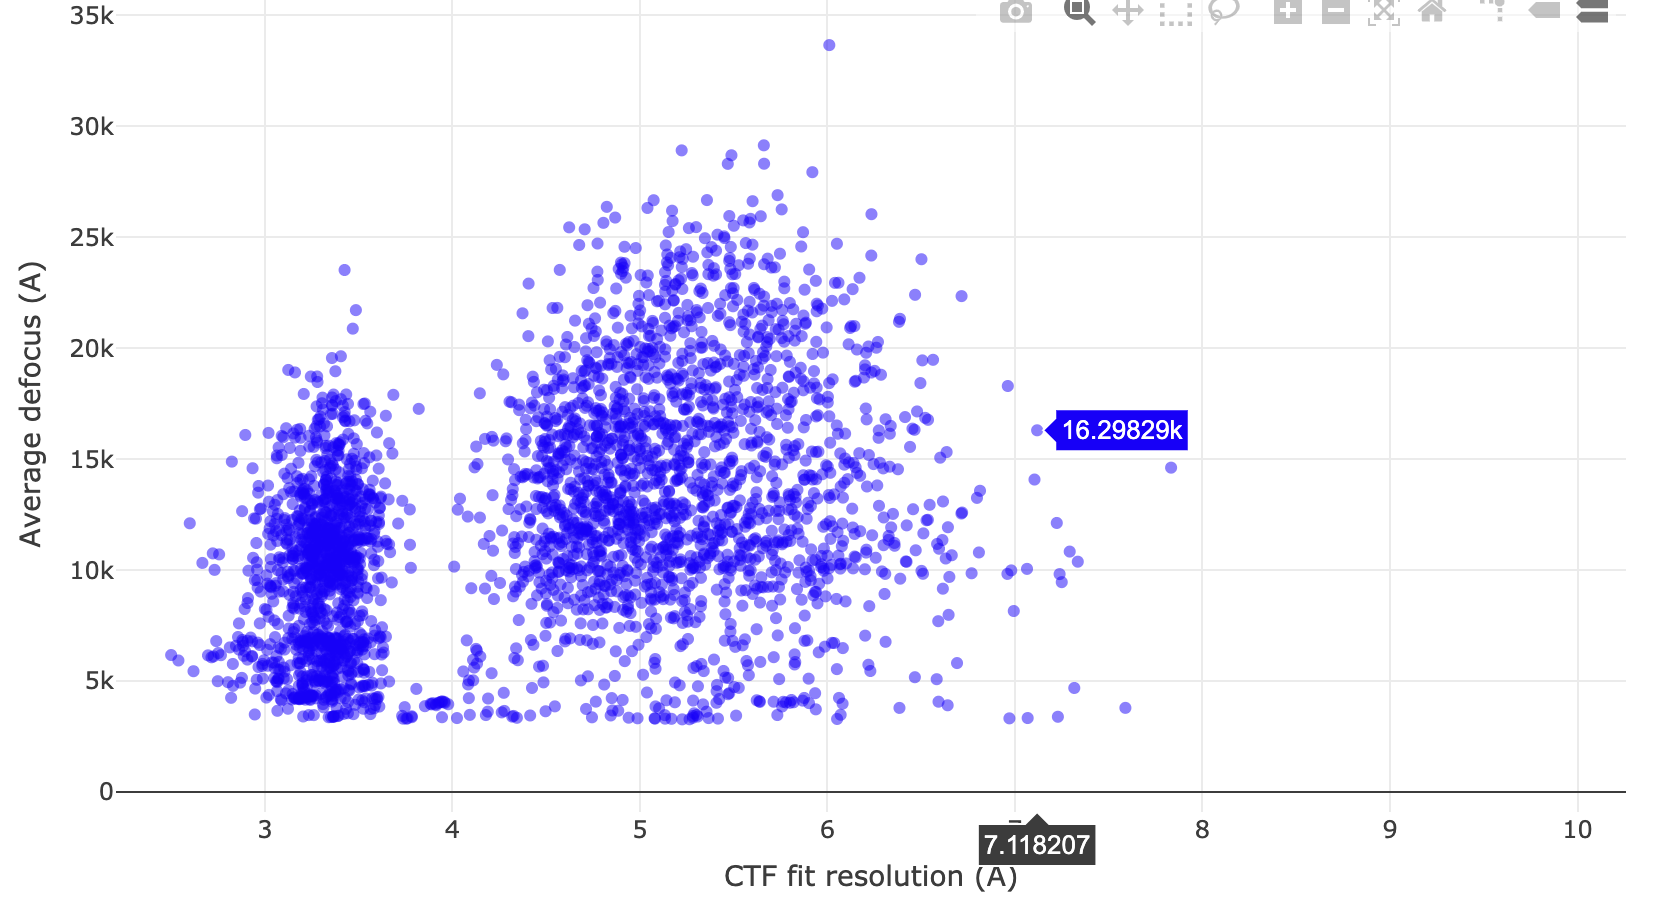
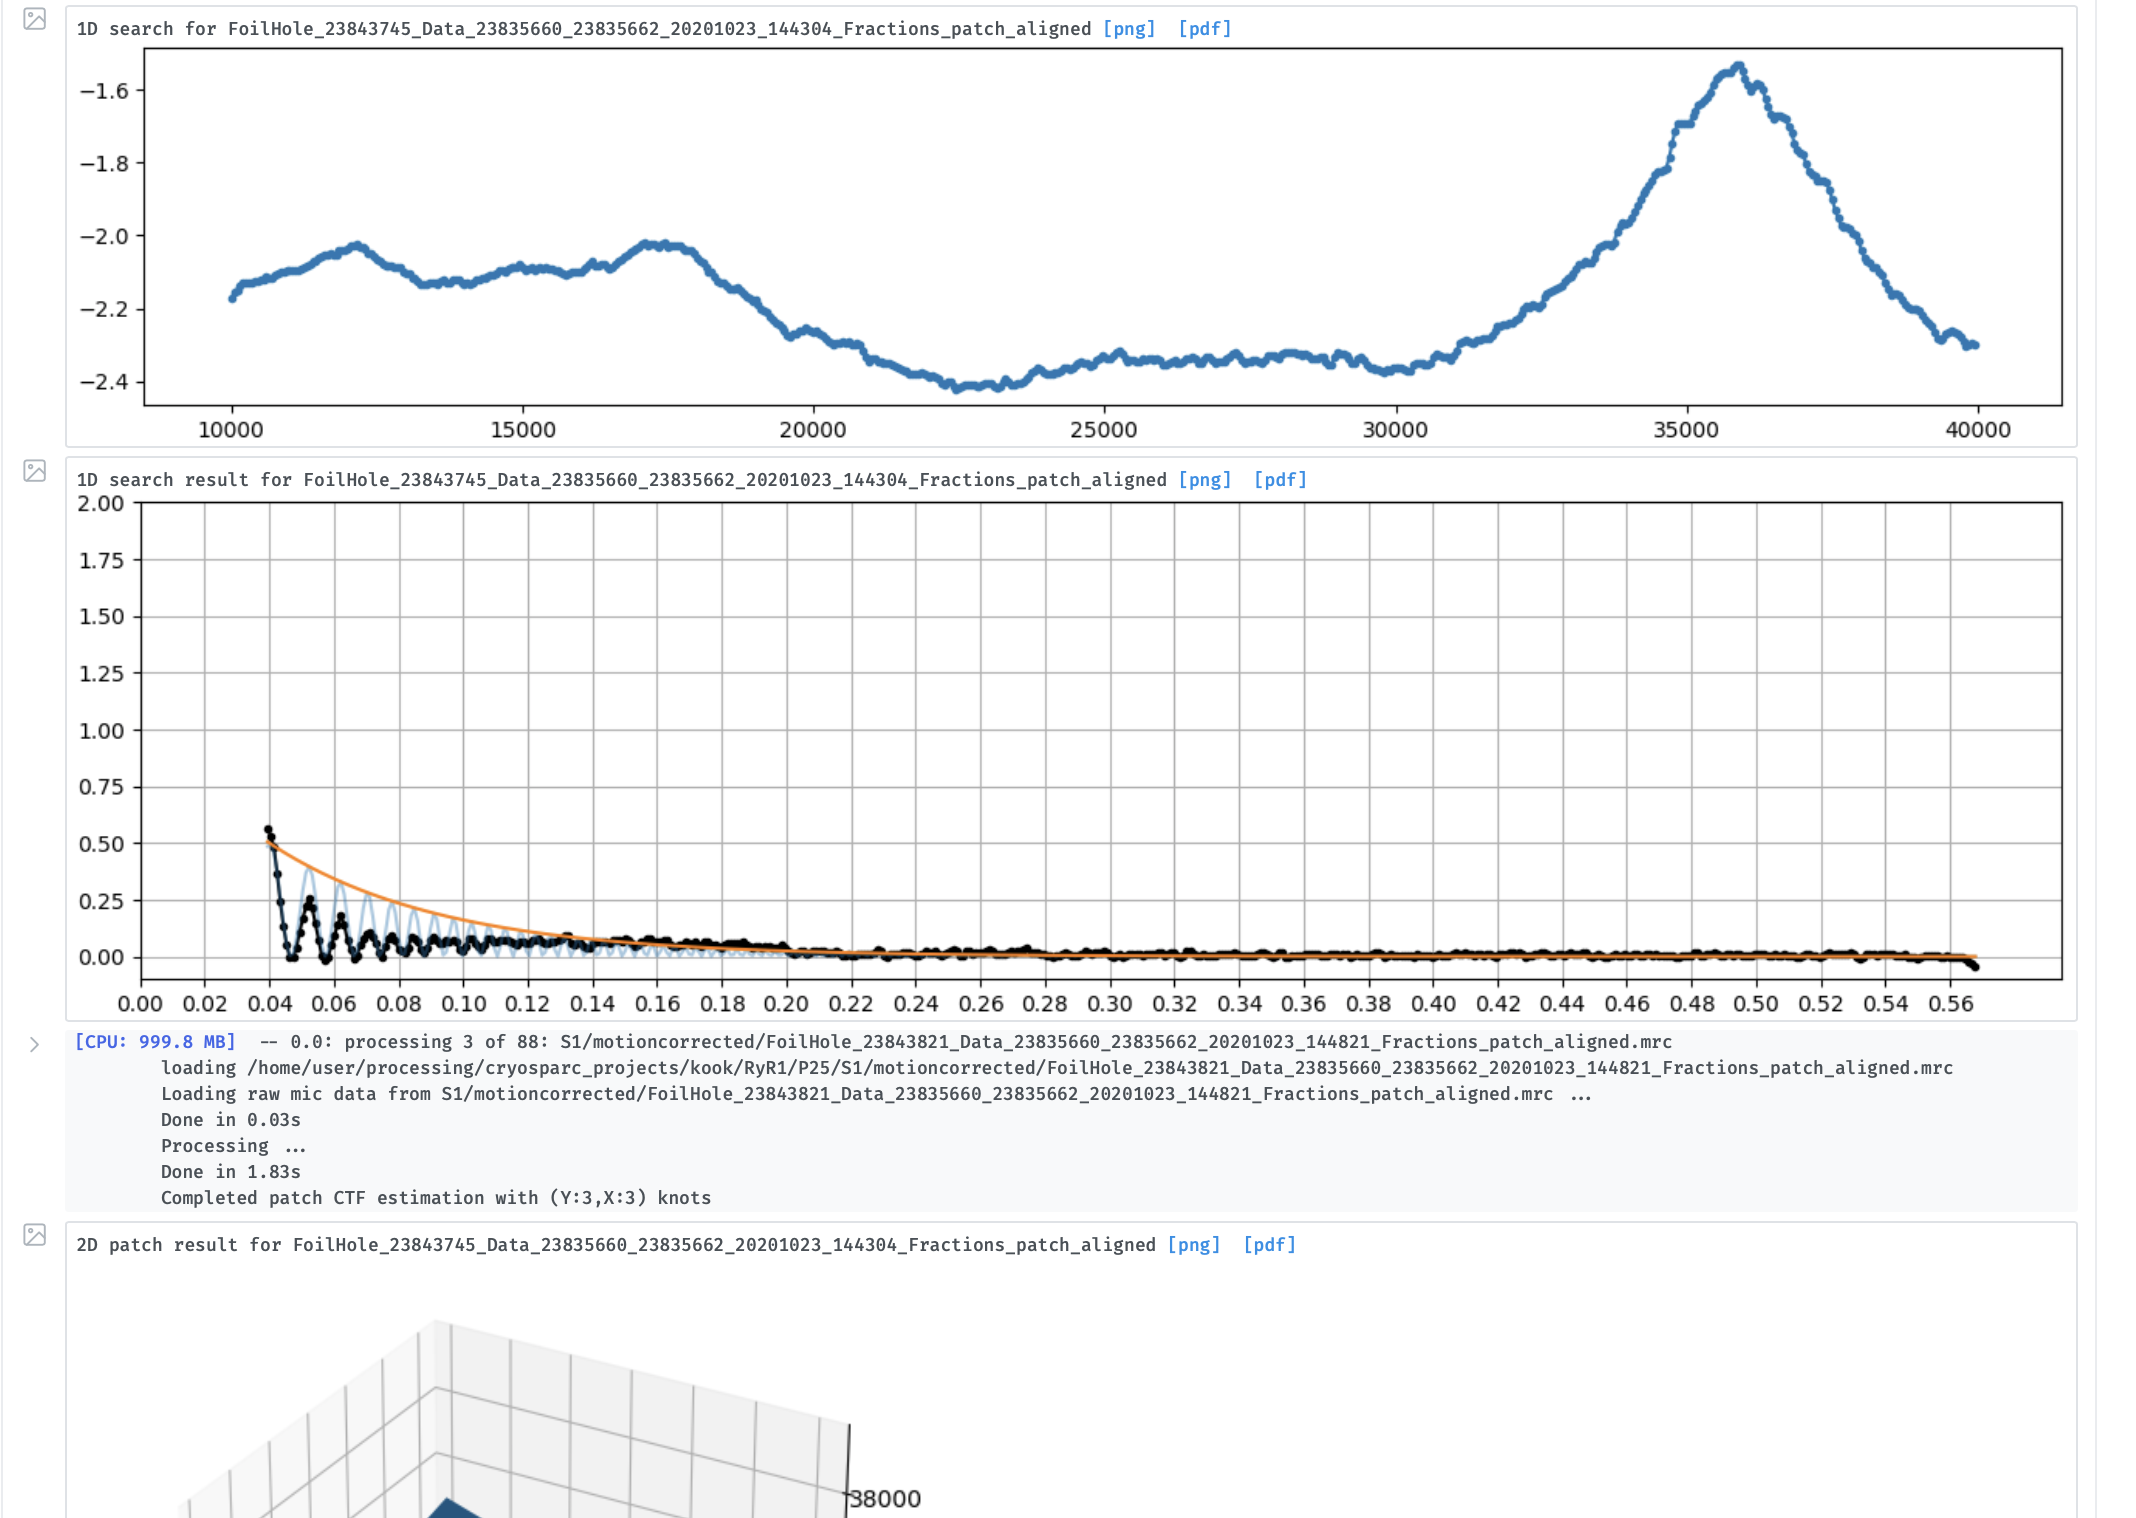
From the two plots you show, the first is quite close to focus, ~0.4 micron. In the 1D plot you can see the place where the fit drops off, close to the water ring. It would be interesting to plot average defocus versus CTF fit, and see if there is a pattern. I suspect that the micrographs close to focus may be the ones that get affected by the water ring, or totally miss the CTF fit and end up at 25 Å.
1 Like
Yes exactly - you can often see if there is a problem by inspecting the 1D search plot. Sometimes you can see that it is catching a spurious maximum very close to focus, which altering the defocus search range allows one to avoid.
Thanks @simonbrown, @olibclarke ! I spoke with our microscopist and he says that he aims the defoci between 1 and 2um with 0.25um increments. Is it surprising that the average defocus misses this intended range by as much as is observed in this dataset especially on the lower defocus end?
The above image also gets to your comment/prediction @simonbrown about those images close to focus being affected disproportionately by the water ring: it seems to my eye that the distribution across CTF estimates at lowest defocus is most equal among the calculated defocus values: it spans the entire range of CTF estimates.
@olibclarke I performed CTF estimation again but this time increasing max resolution from the default 4A to 4.5A and the problem worsened in that more of the images were estimated at CTF values worse than 5A (i.e. excluding data worse than 5A would lead to retention of 43% of the data with 4.5A cut-off whereas with 4A cut-off, excluding data worse than 5A would lead to retention of 55% of the data) . I will test out the defocus range search in another CTF estimation job; where could I see the 1D search plot?
Hi Emily,
No this is a pretty reasonable range - 0.5-3µm with nominal range of 1-2 is about what I would expect. You can find the 1D search plot in the Patch CTF log.
Have you tried plotting these values against index (time)? Maybe one particular part of the data collection was worse due to environmental conditions or whatnot?
Cheers
Oli
1 Like
@olibclarke, I know that the 1D search plot is provided and displayed in the output of CTF refinement, but I can’t find this search log for CTF estimation; can you tell me where I might find it?
Yes, I’ve plotted every estimated value over index with those above 5A excluded to see the distribution of blue v. gray: they’re all seemingly evenly distributed throughout, including that gap in CTF estimate and the pervasive presence of the water ring. I wonder if it has anything to do with the buffer composition. Hmm.
Hi Emily it should be in the log for Patch CTF - by default these plots are only generated for the first few mics, so you need to hit “show from top” to go back to the start of the log. Example attached.
I guess it could just be that you have a bimodal ice thickness distribution - a lot of very thick ice with low SNR and poor CTFn fits, and some nice thin ice?
Also did you notice any difference in particle distribution between the two populations? if all the ones with >5Å had sparse particles, while those with better estimates were crowded, that would make sense maybe?
Cheers
OIi