Hi developer,
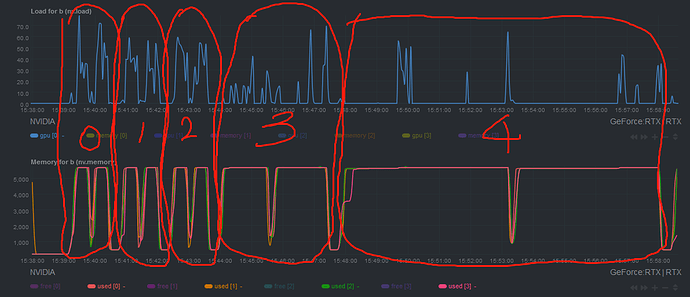
I am running a 2D classification job on a 4 X 3080 GPU workstation. It takes longer to run each iteration, while during an iteration, like iteration 4, the GPU cards are just idle in most of the time. Is this normal?
@hxn Please share more information on the problem:
- box size
- number of classes
- number of particles
and your setup:
- type of storage for cryoSPARC project directory storage (local/network, disk type, network bandwidth)
- particle caching (enabled?, disk type?)
- system DRAM size and load during this job
- CPU type
- possible significant GPU workloads other than cryoSPARC; workload/resource management
Hi wtempel,
box size =256
number of classes=200
number of particles=2.5 million
I use a standalone setup. Project directory is on a raid-5 HDD system and particles are cached in a 2T nvme SSD, particle caching are always enabled.
DRAM usage is roughtly 75G/256G total
2 x Xeon 5218r CPUs. The CPU load during the job is very low (lower than 10%)
No process other than cryoSPARC use the GPU and no workload management software installed.
Meanwhile, it’s also worth of mention, when multiple jobs with the same group of cached data are ran on different GPUs, every job goes very slow. eg, time consumed to run a single iteration of Ab-initio job could show down from 1 seconds to half an hour…
To help eliminate some potential causes, you may want analyze the machine’s behavior during a 2D classification job where
- the OS filesystem cache is enabled
- the particle set is small enough to fit into DRAM
- only 1 GPU is used
- the computer is otherwise idle
and additionally monitor the GPU temperatures, either using the GUI (if it can monitor the temperatures), or with a command like this:
nvidia-smi --query-gpu=timestamp,gpu_bus_id,pstate,temperature.gpu --format=csv -l 5 | tee /tmp/gpus.log
Hi wtempel,
the cache is enabled and roughtly 80% is used.
Particle box size is 256, so the size is small enough,
I used 4 GPUs for new jobs
No other workloads running.
The tempreature was monitored and changes from 30-45 ℃
Recently I queued two similar 2D class job and execute them one by one. The first job runs normally, it takes like 2 min per iteration and 3-4 hour for the last iteration. While the second job became very slow: about 20 min for each iteration and 20 hour for the last iteration. GPU usage and cache disk usage was constantly low. The particles for the two jobs are quite similar (2 million particles for the same dataset) and settings of the jobs are identical (cloned from the first on).
Any idea for the fit? I used cryosparc v 3.3.2.
Just a thought, but have you tried deactivating the SSD cache?
It worth a try, but I actually cannot repeat that slowed performance everytime. If cache is deactivated, normally a job should run faster than the current status…And from the monitoring software, I can see the cache is in use and not bottelneck the program.
I’m just wondering if your SSD might be degraded. If so using the HDD RAID only would be a bit slower than with the SSD, but always the same speed, instead of sometimes slow.
I see, but this is a new disk purchased a month ago, so I think the cache disk itself is still very healthy.
IMO that’s an unwarranted assumption - most component failures are early failures (or late failures - the so-called bathtub curve). If the slowdown never happens on the HDD, then I would try a different SSD. Otherwise it’s some kind of operating system issue. I also recommend trying a utility like htop that will show you the IO rates as well as CPU load so you can see if you’re getting the expecting bandwidth from the SSD.
Hi Daniel,
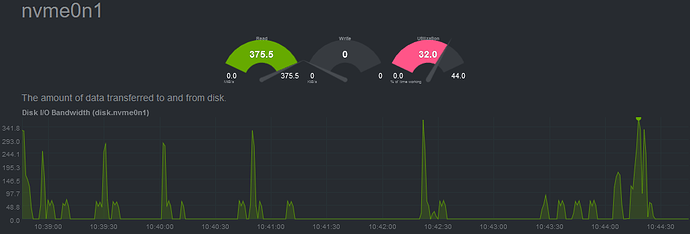
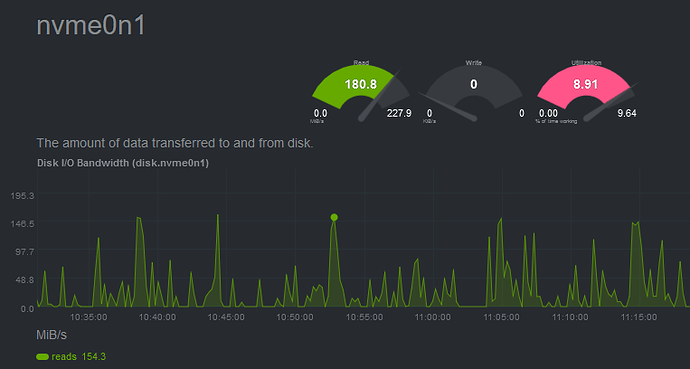
Thank you for the suggestion. I monitored the disk IO while running 3 heterorefine jobs on 3 different GPU cards. The load of the cache remains in a low level. Can this help to exclude the cache disk’s problem?
I do see a repeatable scheme. If I run 3 jobs in parallel on 3 different GPU cards, using the same data cached in SSD, every job is very slow. And when for some reason I kill two of them, the one remained got boosted immediately…That is to say, I can only run one job in normal speed in cryosparc… Is this the problem from CUDA or mpirun or something else?
How much data is it? More than 40% of the system RAM? (The amount of system RAM Linux uses for IO caching by default).
The cached data is about 500 GB.
RAM is 256 GB, and 37 GB in use (in both cases, remain this low)
When these jobs are all running, what is the total IO read / write rate? And is that number about what was advertised for this SSD or no?
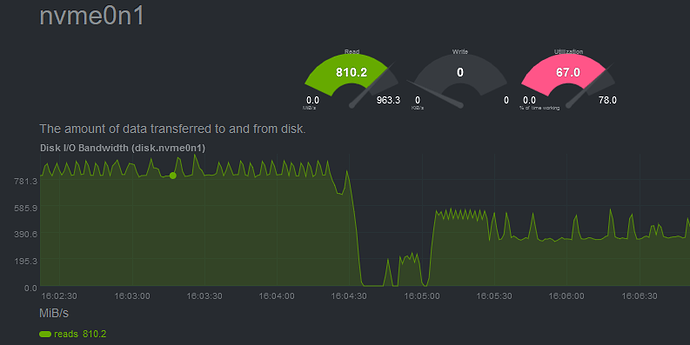
When running one single job, the IO rate is about 800Mb/s, which I think is normal.
While when multiple jobs are running, the IO rate remains very low: ~100 Mb/s, and disk utility also remains low (unlike an HDD when multiple thread is reading simultanously, IO rate goes low while disk utility remains 100%)
Your data is much larger than the cache (up to 40% system RAM, less if that RAM is used for programs), thus it must be read repeatedly from the SSD. The jobs are accessing different subsets of the data in random order, and constantly kicking out each others’ files from the cache. I think that with all three jobs running, you are seeing the true performance of the SSD for parallel, random reads. With just one job, data has a longer cache residence time, you are seeing something closer to effective cached, sequential read performance.
You could try getting another SSD and putting it in RAID 0 with the first one. Something to increase parallel random read performance when the memory cache is small relative to the data.


