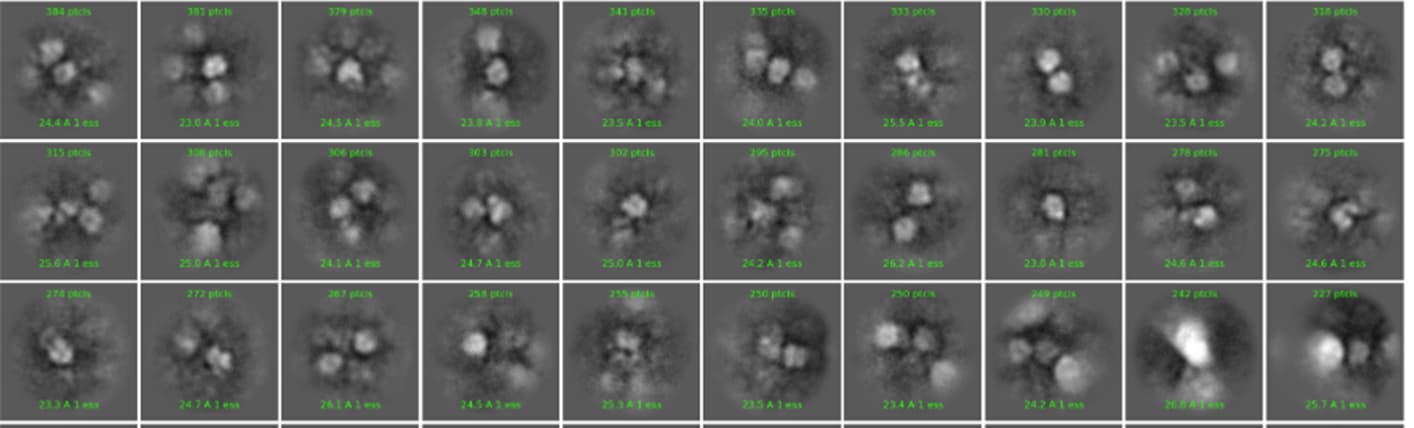
I am writing to seek your inputs regarding a very challenging dataset. Basically, during exposure curation following pre-processing, one strange thing I noticed about this dataset is large CTFs. Selecting micrographs by <5A results in only 4.5K out of about 18K micrographs; by contrast, my other datasets usually contain >95% of micrographs with CTF at 5A or better. After particle picking and extraction with the selected 4.5K micrographs, 2D classification looks very blurry:
I tried playing with the parameters of extraction & 2D (box sizes, class numbers, batch sizes et al) which did not help.
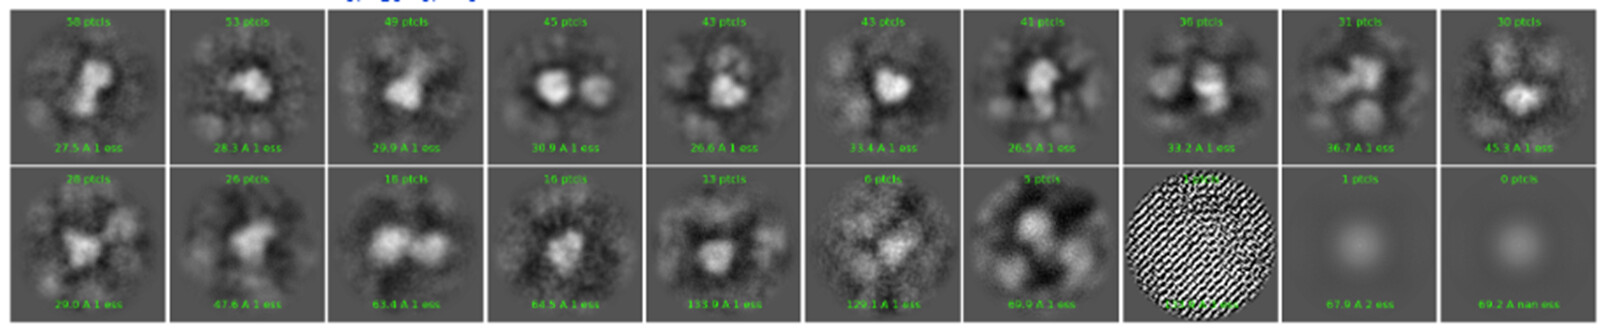
As the most recent step of trouble-shooting, I selected the micrographs with high defocus (>2.5um) and high CTF resolution (> 5A), totaling about 50. I manually picked about 550 particles from them and did a 2D classification, which looks promising IMO:
However, when I used the selected classes for template picking & extraction from the entire curated set (4.5k), the 2Ds look blurry as before.
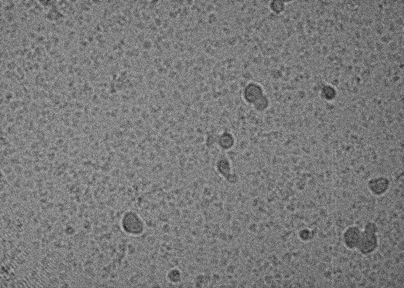
Interestingly, the individual micrographs look fine in my eyes:
My questions are:
There is a high percentage (>75%) of micrographs with bad CTF(lower than 5A). Is this an indication of sub-optimal ice thickness due to bad grid preparation?
For the selected 4.5K micrographs with CTF better than 5A, how accurate the CTF estimates? I mean, is it possible that the entire dataset has bad CTFs and are not usable to solve the structure?
Do the blurry 2Ds indicate low SNRs of the particles, possibly because ice is too thick?
For manual picking, I used micrographs with high defocus and high CTFs. The rationale is that high defocus is good for contrast & high CTF indicates thin ice, so these micrographs are the best of all. Does this sound right?
Is there anything else I can try for processing, before going back to make new grids?
I’d suggest a sanity check with CTFFIND. Either internal of CryoSPARC or external. If micrographs were saved in 16-bit MRC, the only CTFFIND I know of right now which will read them is the version in the experimental build of cisTEM2.
That micrograph looks a little artefacty, which might be a compression effect from the JPG, so can’t say for sure.
To address questions directly, if briefly…
Possibly, although I’ve had some samples with pretty thick ice (only way to get good sample dispersion and some extra angles) and the overwhelming majority of the data has been <4A. What was the dose on camera? Do you have a log? If total dose was set to, say, 40 e-, but dose on camera was <25 e-, yes, your ice was thick. <30 e- would have me checking beam intensity. Generally I am content with 10-20% loss at camera through sample versus through vacuum (<10% loss and ice is usually too thin). Some specific samples break this rule, however.
Check with CTFFIND. If you start doubting CTF fit accuracy, it would hold for all data, though. I like getting eyes on the 2D power spectra, if I can’t fit the simulated fit to both the rotationally averaged and raw power spectra by eye, I dump the micrograph.
Blurry 2D can be caused by a variety of things, not just ice thickness. Does the sample contain anything which would disturb vitrification (glycerol, etc)? How drifty are the micrographs? Does the motion corrected output look sharper?
Easier to pick, easier to align, and for picking you don’t need high resolution so seems reasonable.
The autopicking 2D classes look badly centred. What do the picking results look like? Try optimising that, and running 2D classification with a fairly tight mask around your particle as it looks quite concentrated.
micrograph has beam fringe bottom left, need to align/center/expand beam. micrograph has pixel artifact vertical stripe on right, need to collect/apply gain reference. micrograph looks blurry, this must be not yet motioncorrected. particles looks good, monodisperse not aggregate, repeating size but tumbling shape. normal CTF should be ~3Å for 90% of images. your box size is much too large for the particle. your best data, especially for particles with this very obvious SNR, will be as close to focus as possible to still pick particles - try all those ~1µm defocus. The top 2D looks better than the bottom 2D, are they backwards according to your interpretation? Ice does not look super thick. You could consider data collection at lower magnification, aim for ~800 particles per image with this dispersity - from 1.5Å pixel you can get 3Å structure.
This really depends on particle size and density. For large, sparsely distributed particles in thin ice, this will rarely be the case even for good data.
You could consider data collection at lower magnification, aim for ~800 particles per image with this dispersity - from 1.5Å pixel you can get 3Å structure.
This depends on what is limiting resolution - if the particle is small enough that per-particle SNR is limiting initial orientation assignment, you might actually be better going to higher mag (and/or higher dose).
your box size is much too large for the particle
Hard to be sure of this without seeing a scale (and knowing the mean & ~max defocus). Remember optimal box size eq based on CTF delocalization:
B=Box Size (Å)
D=Diameter of particle (Å)
L=electron wavelength (Å, 0.02 at 300kV)
dF=Defocus (Å)
d=Target resolution (Å)
(of course there are multiple caveats to this - it doesn’t consider the corners of the box, or take account of particle crowding/aggregation - but it is a good starting point for tweaking)