Hi everyone,
Is there a way to extend the Power and CC axes so that you can see the entire range? My picks are grouping in the bottom left corner are being cut off which makes it difficult to trim the data set down.
Thanks!
Matt
Hi everyone,
Is there a way to extend the Power and CC axes so that you can see the entire range? My picks are grouping in the bottom left corner are being cut off which makes it difficult to trim the data set down.
Thanks!
Matt
Hi @mjmcleod64,
The NCC and power threshold sliders should allow for selecting the entire range of values seen across your input micrographs. Are you unable to click and drag the slider handles to the edges?
Thanks,
Suhail
Nope the sliders work as they should, but the actual graph appears to have cutoff the heatmap so I can’t see the limits at the low end.
Hi @mjmcleod64,
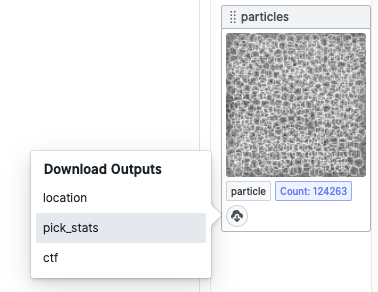
Apologies for the delay! The graph and slider use the 1st and 99th percentile as the minimum and maximum value to plot so that outliers are not included. There shouldn’t be many picks that extend out of those bounds. You can verify this by downloading the passthrough_particles.cs file (when the job preview dialog is open, navigate to the first tab and click the download button associated with the particle group → ‘pick_stats’:

Once you’ve downloaded the .cs file, it’s easy to inspect using the cryoSPARC interactive CLI, more details are provided here: https://guide.cryosparc.com/processing-data/tutorials-and-case-studies/manipulating-.cs-files-created-by-cryosparc
Each pick will have a field such as pick_stats/ncc_score and pick_stats/power which you can manually inspect or perform stats on.
- Suhail