Yes agreed - I would always trust my eyes over anything else… would be nice to have a single stat to report on anisotropy for the purposes of validation/table 1 though. Maybe SCF* is more reliable?
Or just the plus/minus one sigma directional resolution range (which unfortunately isn’t given numerically in orientation diagnostics)? I think in this case this more accurately tallies with the visual appearance of the map - approximately 2.7 in one direction, 3.2 in the other feels right
EDIT:
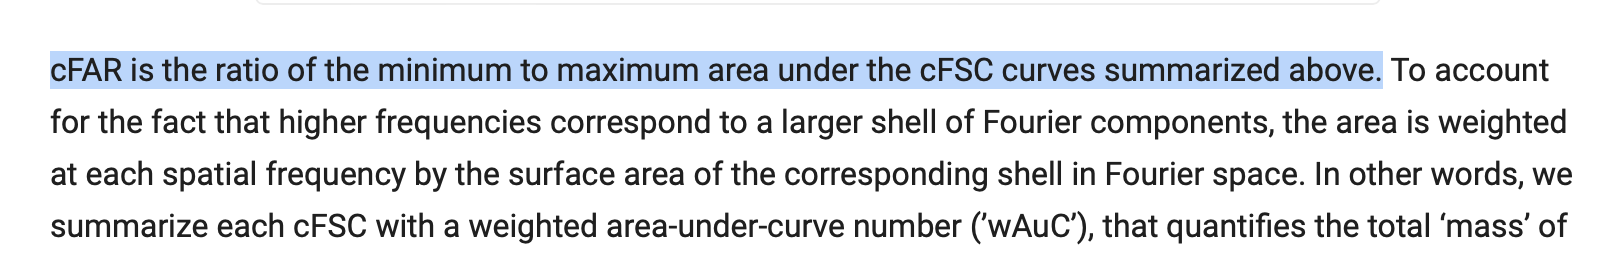
I think this is probably the reason - the cFAR is literally the min/max FSC area ratio, which means a single outlier will throw it off dramatically.
I wonder if either using the plus/minus one-sigma curves for cFAR calculation, or weighting somehow by the population of each resolution bin, would give more useful/reliable results.
Also, updated the original post - the toroidal FSCs do not show this behavior, exhibiting only moderate anisotropy, so I wonder if a wAUC ratio of the min/max or plus/minus one sigma of those might be worth considering.