The local motion output for this (and other micrographs with equally weird plots) still indicate that around 500 particle images are being motion corrected and extracted. I used inspect picks to double check the particle set I used as input for this local motion job, and the number of particles per movie makes sense. The weird local motion plots appear to be a bug related to running local motion jobs on patch motion corrected movies that have a big motion in the X-direction.
Thanks for reporting!
Do you have any confirmation that the particle outputs themselves from the local motion job are incorrect?
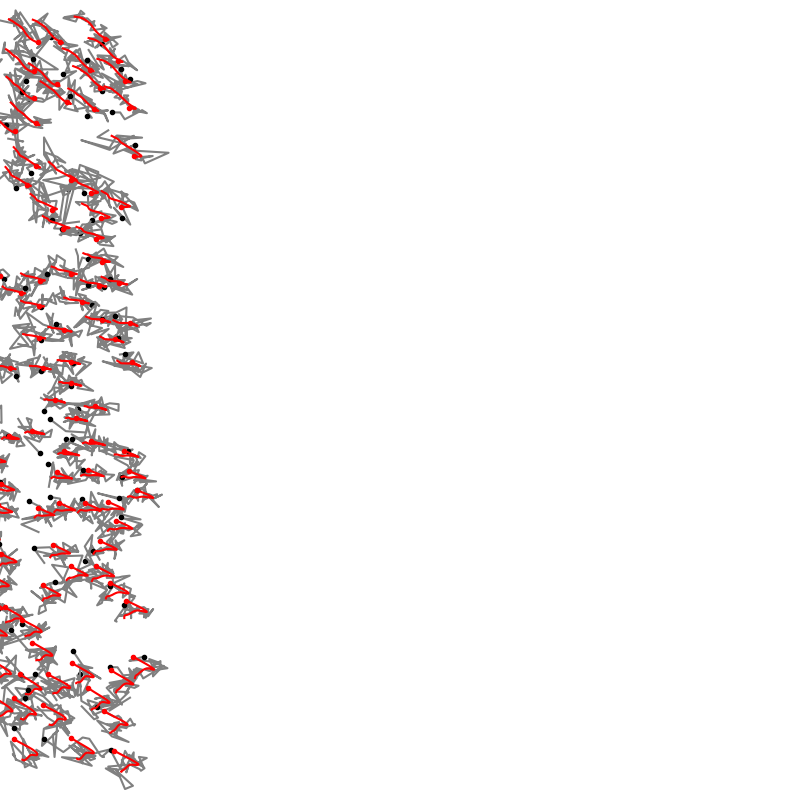
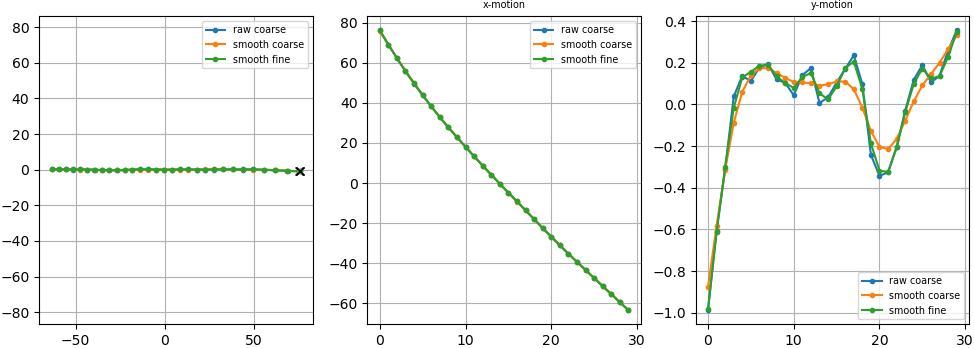
From what I can tell so far, this is a bug only in the plotting itself of the trajectories (probably related to the fact that we “magnify” the trajectories by a factor of 40 before plotting, and if there is already a very large x-shift in the trajectory from the rigid motion computed during patch-motion, that might be causing the plot to shift right out of the image area.
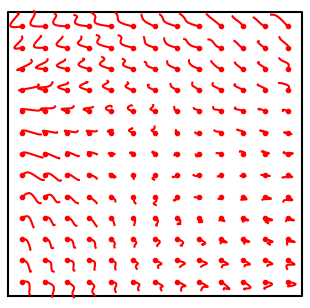
But still this should not have any effect on the trajectories. Looks like in this case the patch-motion trajectories and the per-particle trajectories for particles we can see (right edge of the micrograph) are in good agreement.