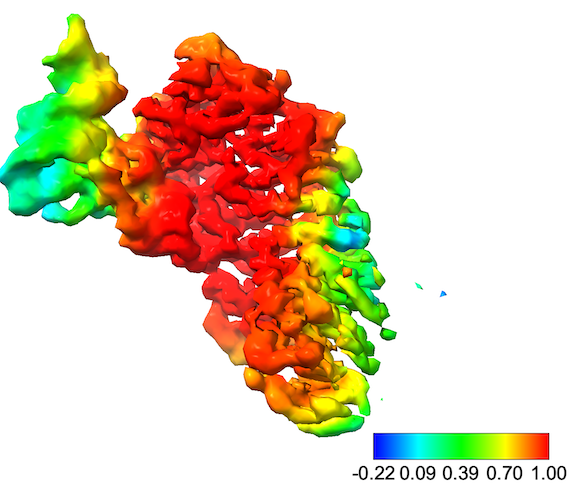
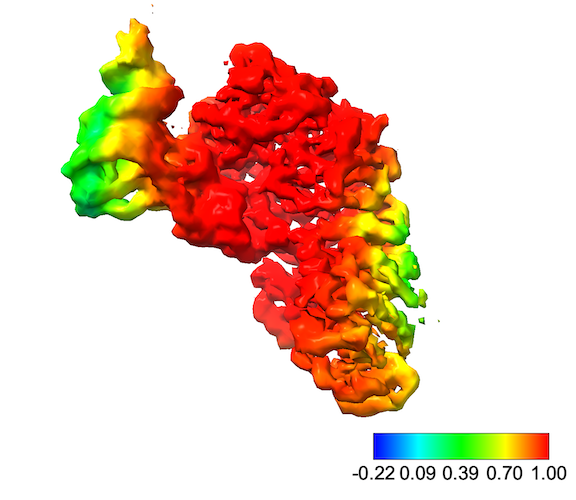
I have a tRNA-protein dataset with a severe preferred orientation, to the extent that I had to collect full data at a tilted angle to get an interpretable map. I have a low cFAR score (0.1-0.2) so I was curious was 3DFC from Orientation Diagnostics job looked like. My initial extraction box was 360 px, around 2X of my particle. From 3DFSC I noticed that the middle of the map I had a high correlation but outer side of the map had much lower correlation in one direction of the map. Afterwards, I reextracted the particles in 432 px. While cFAR did not change, the regions with higher correlation (red regions) increased but I still have this strange border between high and low correlation regions (2nd screenshot) in one direction.
Can anyone explain why I inner parts in one direction of the map would have a significantly higher correlation than the outer parts and why the bigger box increases the size of this red region?
Hi @Ana – the 3DFSC volume is the 3D expansion of the “cFSC” plot in orientation diagnostics. Each of the 3072 curves is traced along its corresponding conical axis in 3D and the correlation values are inserted into the appropriate voxels within the volume. The higher correlations at the centre of this volume correspond to the higher correlations at the low wave numbers (i.e., low resolution values) within the cFSC plot – that is, they indicate that the half maps are nearly identical at low resolutions. The directional-dependence of the correlations as you move away from the center of this volume (i.e., go to better resolutions) is exactly what gives rise to a non-1 cFAR score.
Note that you can’t easily map conical directions to viewing directions, which is why we introduced “relative signal” which gives you a direct measurement of correlation vs. viewing direction. See the orientation diagnostics job page for more info.
I’m not sure exactly what’s happening with the box size – can you give some more info about what we’re seeing here? Did you re-extract the particles and then re-run refinement / orientation diagnostics to produce this new volume?
Finally, out of curiosity, what are you looking to visualize with this type of plot?
This is for the paper, the reviewer requested 3DFSC of the map. Is there any other way to get 3DFSC?
Gotcha! You’ll probably need a bit more info about what the reviewer is looking for. The 3DFSC volume is output by orientation diagnostics, but there are different ways to summarize it. You can, for instance, just visualize it in Chimera overlayed on top of the volume, at a threshold of 0.143 and a translucent colour. You can also compute the volume and area of the 3DFSC thresholded at 0.143 and use those values to compute ‘sphericity’. Sphericity quantifies how close to uniformly spherical this thresholded volume is (this is described in the 3DFSC paper) and it can capture similar information to the cFAR score.