Hi ! I was wondering how and whether it would be possible to use the output from cryosparc (map, .cs files) to generate the classical sphere with bars around a volume, visualized in chimera. I am perfectly fine with the 2D representation of angular distribution automatically generated by cryosparc, but has someone ever tried ? maybe @olibclarke ?
Hi @sdawood, many thanks for your help with this. I was indeed looking for a solution to avoid exporting to relion, maybe something to use the .cs file directly, but probably it does not exist… cheers and thanks again
You don’t need to use Relion at all, just pyem. It will generate a .bild file that you import to chimera. It can look really nice and it’s easy to generate once you get pyem working, just make the star file, then: star2bild.py particles.star —sym c4 particles.bild
many thanks for the tipp, @user123. @DanielAsarnow too, could you maybe give me a step-to-step guide on what files to use from cryosparc (let’s assume it’s the output from a NU refinement job), and what commands in pyem ?
generate a .star file from the output of a NU refinement job. What files to take from cryosparc and what’s the command in pyem
star2bild.py particles.star —sym c4 particles.bild
Here I have c1 symmetry, did you put c4 as this was your case ?
1- Download the particles alignments 3D file from the outputs section.
2- Generate the star file using that .cs file - “csparc2star.py p1_j123_particles.cs p1j123_particles.star”
3- Generate the bild file using the new .star file - “star2bild.py p1j123_particles.star p1j123.bild”
4- Open your map and new .bild file in chimera.
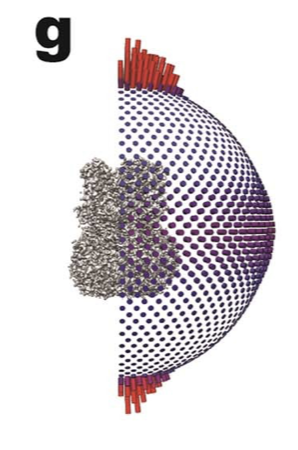
The --sym c4 flag generates the bild file to be viewed as 1/4 sphere, rather than full sphere. More of the user’s personal preference. See the example below using C4 bild file while the protein has C5 symmetry.
On this topic I am having a few issues. Trying to make a .bild file as suggested above. Seem to work fine but with a few issues.
The final bild file generates particle distribution that is off-center. I tried specifying the box size but that did not help.
I also get an error when I try the --sym C4
Traceback (most recent call last):
File “/usr/bin/star2bild.py”, line 114, in
sys.exit(main(parser.parse_args()))
File “/usr/bin/star2bild.py”, line 43, in main
args.sym = util.relion_symmetry_group(args.sym)
File “/data/CRYOSPARC/pyem/pyem/util/util.py”, line 46, in relion_symmetry_group
for i in range(1, len(lines), 4)]
File “/data/CRYOSPARC/pyem/pyem/util/util.py”, line 46, in
for i in range(1, len(lines), 4)]
File “/data/CRYOSPARC/pyem/pyem/util/util.py”, line 45, in
[[np.double(val) for val in l.split()] for l in lines[i:i + 3]])
File “/data/CRYOSPARC/pyem/pyem/util/util.py”, line 45, in
[[np.double(val) for val in l.split()] for l in lines[i:i + 3]])
ValueError: could not convert string to float: ‘R(3)=’
I am not entirely sure what caused the issue, but I noticed when I applied the script on other data sets everything works just fine. I re-tried the refinement and the issue went away. Puzzling, but at least everything is working. Thanks anyway! If I can get to the bottom of the issue, I will let you know
@DanielAsarnow
When I did the 3rd step, I got a line asking for the box size. How shall I add the box site on to the star2bild.py command? Mine doesn’t have symmetry. Shall I just leave --sym out?
(3- Generate the bild file using the new .star file - “star2bild.py p1j123_particles.star p1j123.bild”)
Hi,
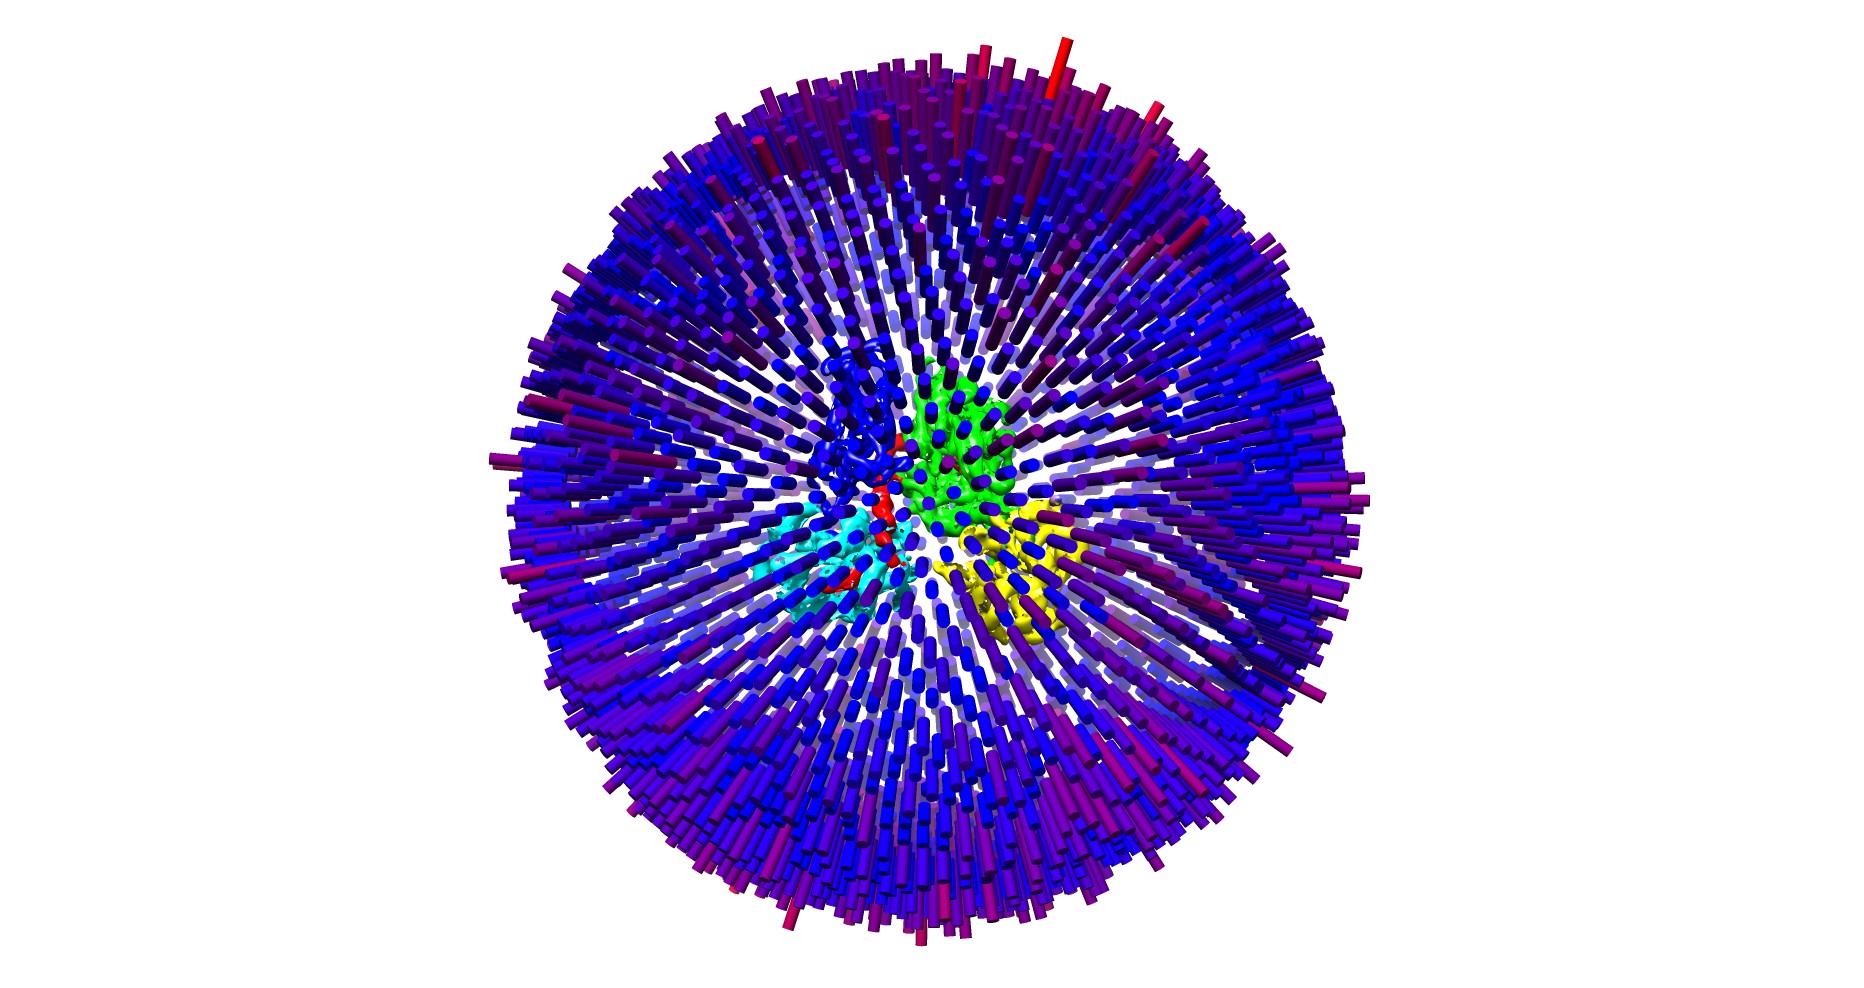
I have generated the global orientation distribution by following this thread. How do we find out counts for each cylinder? I was thinking about drawing a bar graph indicating the counts for blue to red color or discribe it in the figure legend. Can somebody help me with this? Thanks very much!
It makes sense to have a colorbar. I might add something to make that easier in the next few weeks. If you are comfortable playing around with the code you could probably add a few print statements and get what you’re looking for faster.
@elaine@yy314 I added a couple of logging statements to star2bild.py. If you use star2bild.py --loglevel info then it will print the mean and std counts over the bins, and the size and color of the minimum and maximum bins. The color for fewer particles than 1 std below the mean is always 0,0,1 and for more than 5 std above is always 1,0,0. (These values were all taken directly from the Relion source code in order to replicate the plots).