I figured it out- here’s the answer in case anyone else falls into a similar position.
I added
%matplotlib
At the very beginning of the cell to manually plot the latent coordinates.
After running the cell, I get a popout window with the latent points graphed as in with the previous graph. If I just start clicking points, the points do not show up, the first point is recorded where I click, but subsequent points are somehow translated and zoomed out to a totally different location. Again, I can’t see where I’ve clicked because nothing shows after clicking, but the coordinates are recorded, although translated and worthless. I can even run the 3D Generate job with these coordinates, but they’re useless as most of them are in a space without any datapoints.
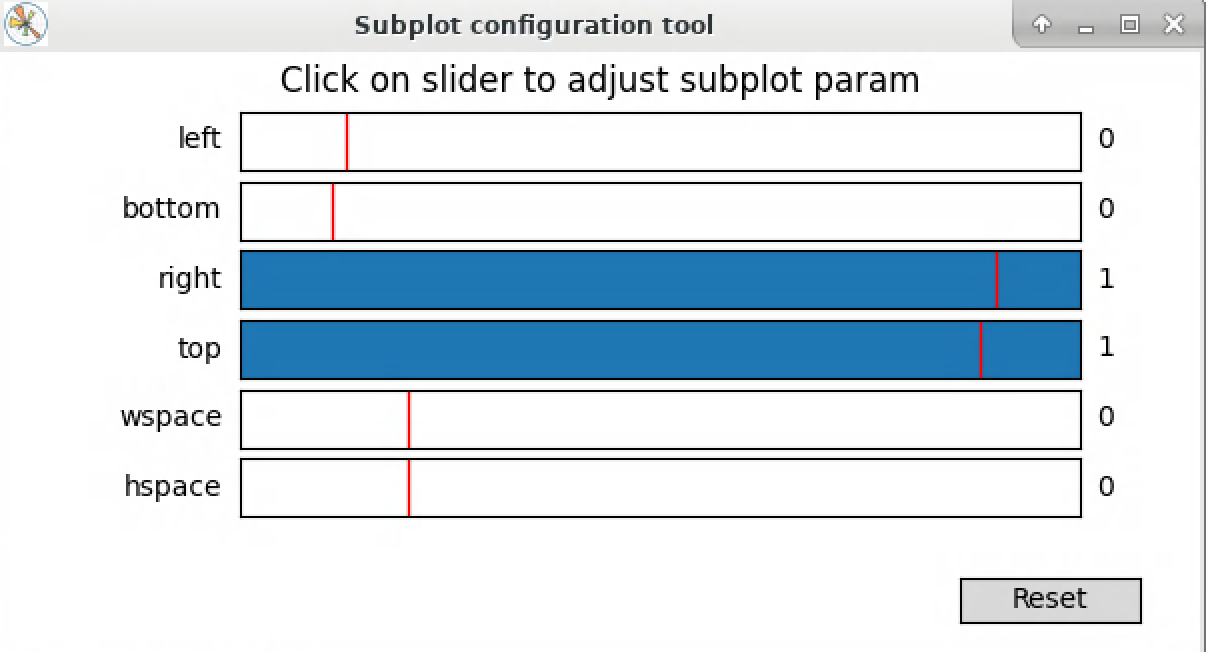
If, however, I instead adjust the parameters to what is seen here, suddenly I can click and save red dots as per the example, and the points are seen and recorded in the correct location on the plot, and not unusually translated anywhere.