3D Flex - Creating Custom Latent Trajectory

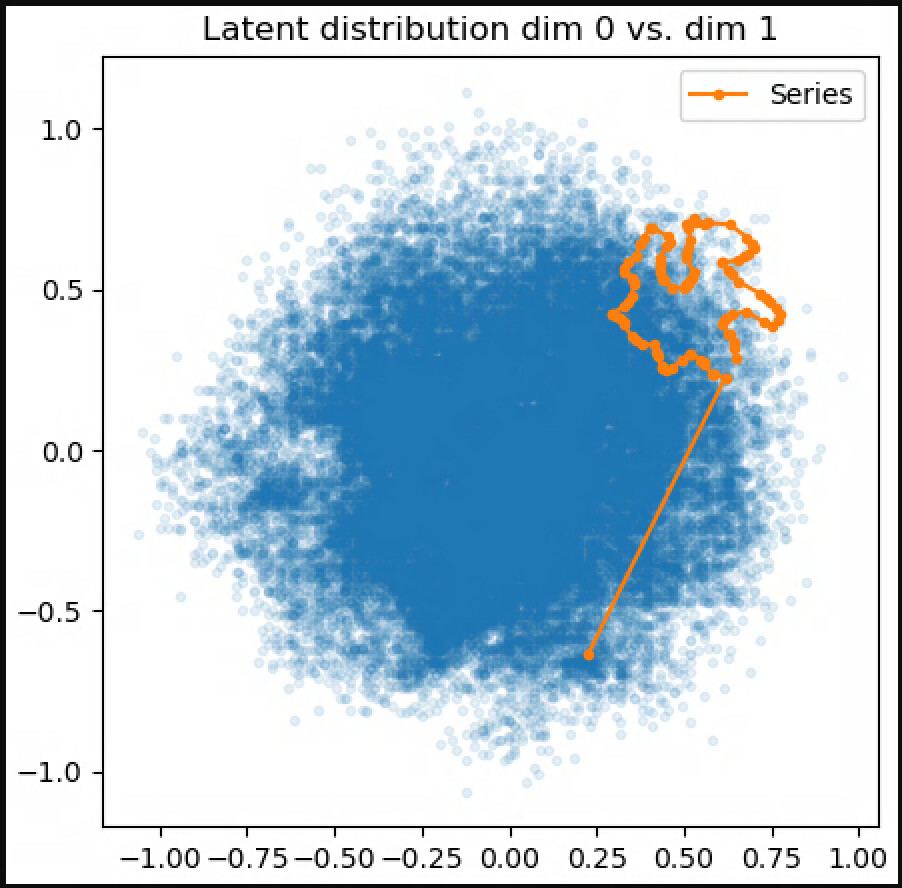
I am using the Jupyter notebook to create a custom latent trajectory for my 3D Flex Generator. However, now that I’ve gotten to the point of loading in my data and graphing it, I can’t create the custom trajectory by clicking on points- it doesn’t show any red point or line at all. Have I created a plot that is not interactive?

I had to manually activate pandas and matplotlib in the script in order to get this far, maybe I’ve just missed loading some other library required for the interactivity?

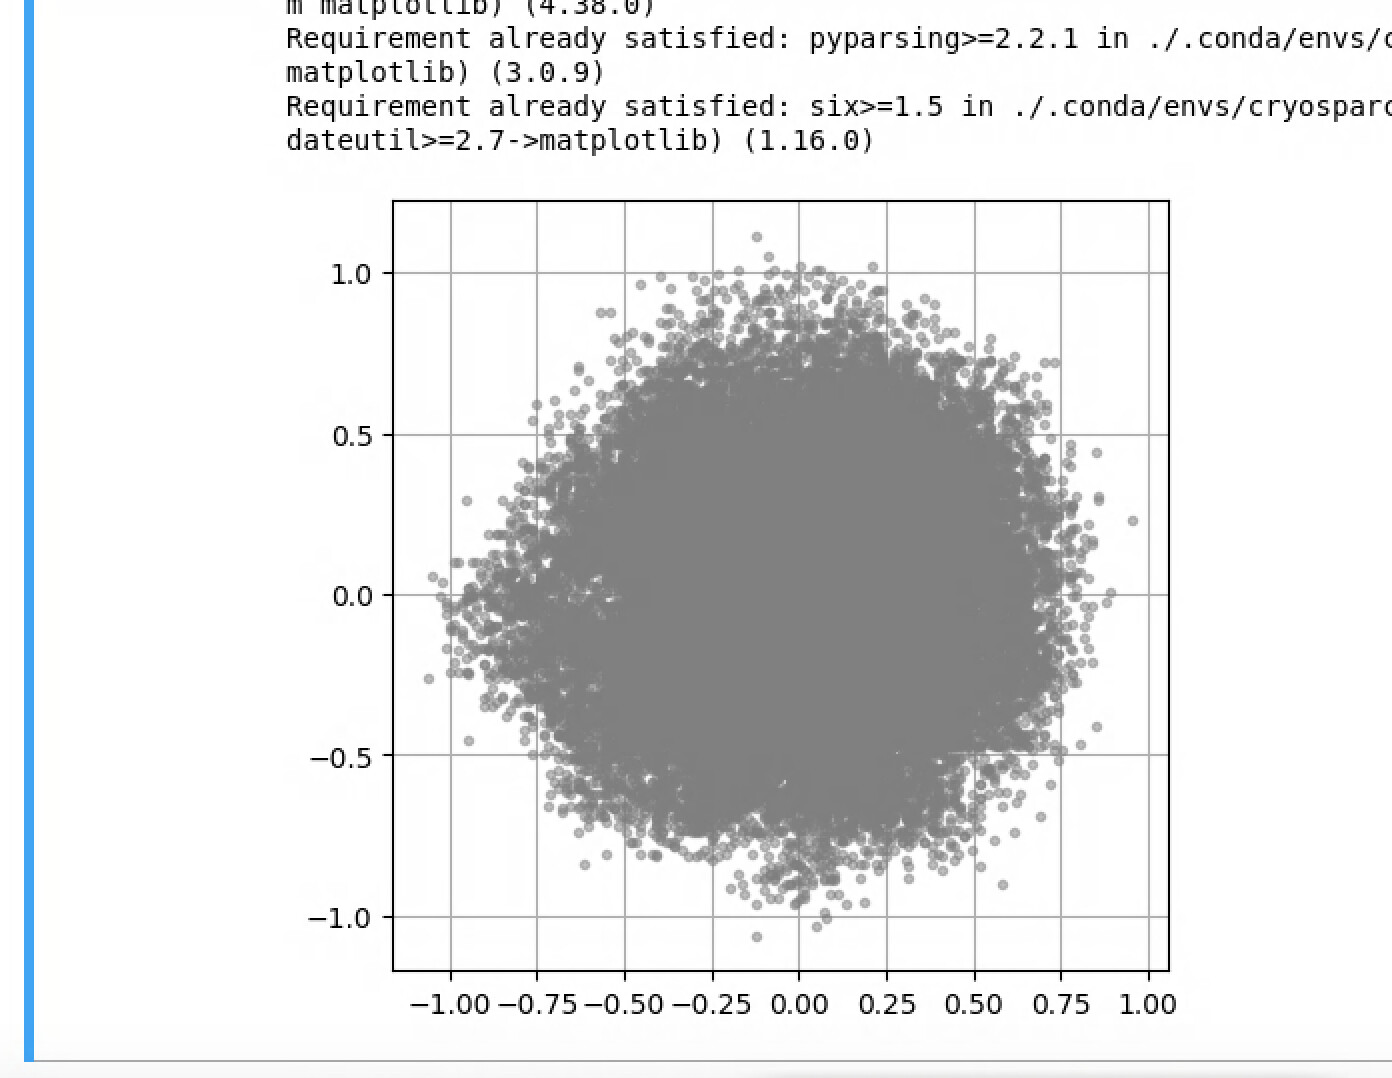
This is the output seen after running the plot portion of the notebook:

Hi @jenchem , do you have the line
%matplotlib inline
before this cell? The plot should display in an in-browser interactive widget rather than a static image once the inline mode is engaged.

This is what is in the cell I ran to give me the static plot:

!pip install matplotlib
from matplotlib import pyplot as plt

fig = plt.figure(figsize=(5, 5))

def do_plot():
plt.plot(
particles[“components_mode_0/value”][::10],
particles[“components_mode_1/value”][::10],
“.”,
alpha=0.5,
color=“gray”,
)
plt.grid()

do_plot()

chain = True
pts = []

def onclick(event):
fig.clf()
do_plot()
pts.append([event.xdata, event.ydata])
apts = n.array(pts)
if chain:
plt.plot(apts[0, 0], apts[0, 1], “xk”)
plt.plot(apts[:, 0], apts[:, 1], “.-r”)
else:
for k, i in enumerate(range(0, len(apts), 2)):
plt.plot(apts[i, 0], apts[i, 1], “xk”)
plt.plot(apts[i : i + 2, 0], apts[i : i + 2, 1], “.-”, label=str(k))
plt.legend()

cid = plt.gcf().canvas.mpl_connect(“button_press_event”, onclick)

I had to add the first line because matplotlib wasn’t installed in my environment in the jupyter notebook I was accessing via a remote Firefox browser. Other than that I didn’t change any of the code. Should
%matplotlib inLine
be placed after installing matplotlib? Or should it be at the end of the previous cell?

I was actually able to get points output using
%matplotlib

But there was no interactive output in the plot showing any red dot to indicate where I had been clicking. I clicked fairly randomly in a circle in the plot, output the points, and ran the new 3D Flex Generator job. I got output, but the plot it shows of the latent points is way off of from the locations I actually clicked on- instead, it’s got everything grouped in the upper right corner except for one dot. I’m going to continue trying to troubleshoot what went wrong.

Edit: Maybe I should mention that the only way I was able to get this far was using
%matplotlib

%matplotlib inline
resulted in a static image within the jupyter notebook that was not interactive and did not output points in the next cell.

I figured it out- here’s the answer in case anyone else falls into a similar position.

I added
%matplotlib

At the very beginning of the cell to manually plot the latent coordinates.

After running the cell, I get a popout window with the latent points graphed as in with the previous graph. If I just start clicking points, the points do not show up, the first point is recorded where I click, but subsequent points are somehow translated and zoomed out to a totally different location. Again, I can’t see where I’ve clicked because nothing shows after clicking, but the coordinates are recorded, although translated and worthless. I can even run the 3D Generate job with these coordinates, but they’re useless as most of them are in a space without any datapoints.

If, however, I instead adjust the parameters to what is seen here, suddenly I can click and save red dots as per the example, and the points are seen and recorded in the correct location on the plot, and not unusually translated anywhere.