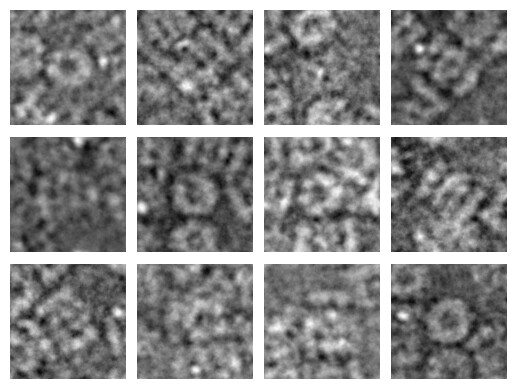
Hi @olibclarke! Definitely can be done on the fly. We use internal code to present the images, so this won’t be exactly the same as what you see in the GUI, but using scikit-image’s Butterworth filter, we can produce this plot of low-pass filtered particle images (note the images are of different particles b/c the script picked a different random sample when I re-ran it):
from skimage.filters import butterworth

N = particle_images[0].shape[0]

def lowpass(img):
    return butterworth(
        img,
        cutoff_frequency_ratio = 6/N,
        high_pass = False,
        order = 1
    )

fig_lp, axs_lp = plt.subplots(3, 4)
plt.subplots_adjust(wspace=0.1, hspace=0.1)
axs_lp = axs_lp.flatten()
for idx, ax in enumerate(axs_lp):
    img = lowpass(particle_images[idx])
    ax.axis('off')
    ax.imshow(img, cmap = 'gray')

fig_lp.show()