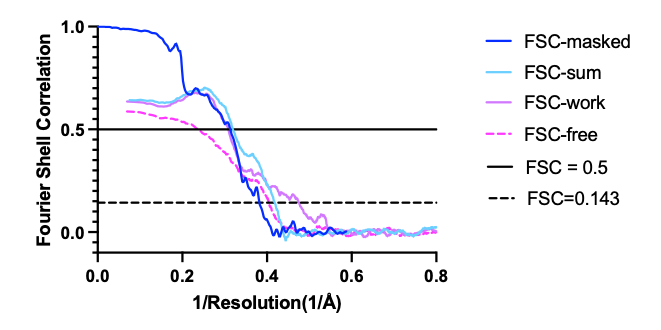
I have two related questions about this FSC plot (helical fibrils, ~2.6–2.7 Å final resolution, Phenix real-space refine cross-validation, RELION 5):
-
There is a big, systematic gap between FSC-work and FSC-free — confirmed from the raw per-shell data (not just the plot), roughly 0.13–0.18 in the 3–5 Å and 2–2.5 Å bins.
-
Near FSC = 0.143, the four curves aren’t closely converged — FSC-free in particular drops noticeably faster than FSC-masked/FSC-sum through the mid-resolution range, widening the spread by the time it reaches the 0.143 threshold.
My suspicion is that these two observations are actually the same underlying problem viewed two ways — the free curve dropping unusually fast in the mid-resolution range is what’s producing both the work/free gap and the uneven spread near 0.143 — rather than two separate issues.
Thanks in advance for any input!